
“Consumerismo” denuncia l’eccessivo consumo di farmaci in Italia, sostenendo che siamo ai vertici della classifica dell’Unione Europea. Riportiamo alcuni stralci e rimandiamo all’full article for those who want to learn more
Italians "addicted" to drugs. The analysis of Consumerismo NP
HEALTHCARE, CONSUMERS REPORT: IN ITALY ABNORMAL GROWTH IN EXPENDITURE FOR DRUGS, WE ARE AT THE TOP OF THE EU RANKING
The OsMed report elaborato da Aifa ci dice che nel 2019 crescono i farmaci acquistati dai cittadini di tasca propria. I medicinali di fascia C registrano una spesa di 5,7 miliardi di euro – con un aumento del 6,6% – di cui il 53,6% per farmaci acquistati con ricetta e il 46,4% per i medicinali di automedicazione Sop e Otc. Lo rileva il Rapporto 
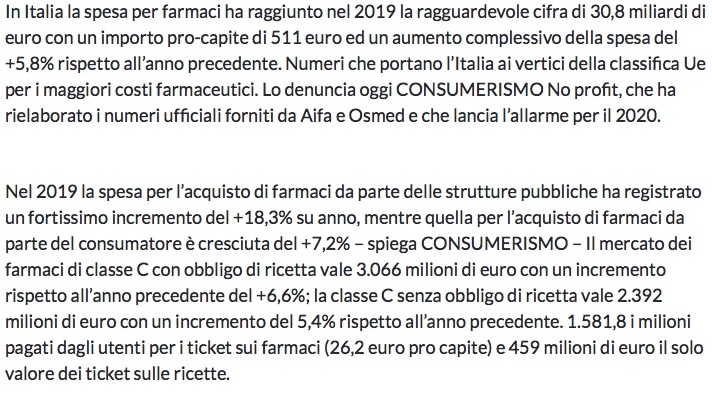
Furthermore, in 2019 in Italy, the per capita pharmaceutical expenditure, including medicines purchased directly from public health facilities and those dispensed through the affiliated channel, was equal to 384.43 euros. In 2019, total pharmaceutical expenditure was €30.8 billion, an increase of 5.8% compared to the previous year.
Farmindustria poi nel suo “Pharmaceutical indicators” pubblicato nel luglio scorso sostiene che il prezzo medio dei farmaci in Italia è il più basso fra i grandi Paesi europei.
2019 recorded a slight increase in the prices of medicines (+0.2%), with inflation at +0.6%. The fall in the prices of reimbursable medicines continues, -1.0% compared to the previous year.
Despite the plus sign of the 2019 figure, in the long term the price of medicines is decreasing: since 2001 they have fallen overall by 34.2%, against an increase in inflation of 33.3% and cost increases in practically all their voices.
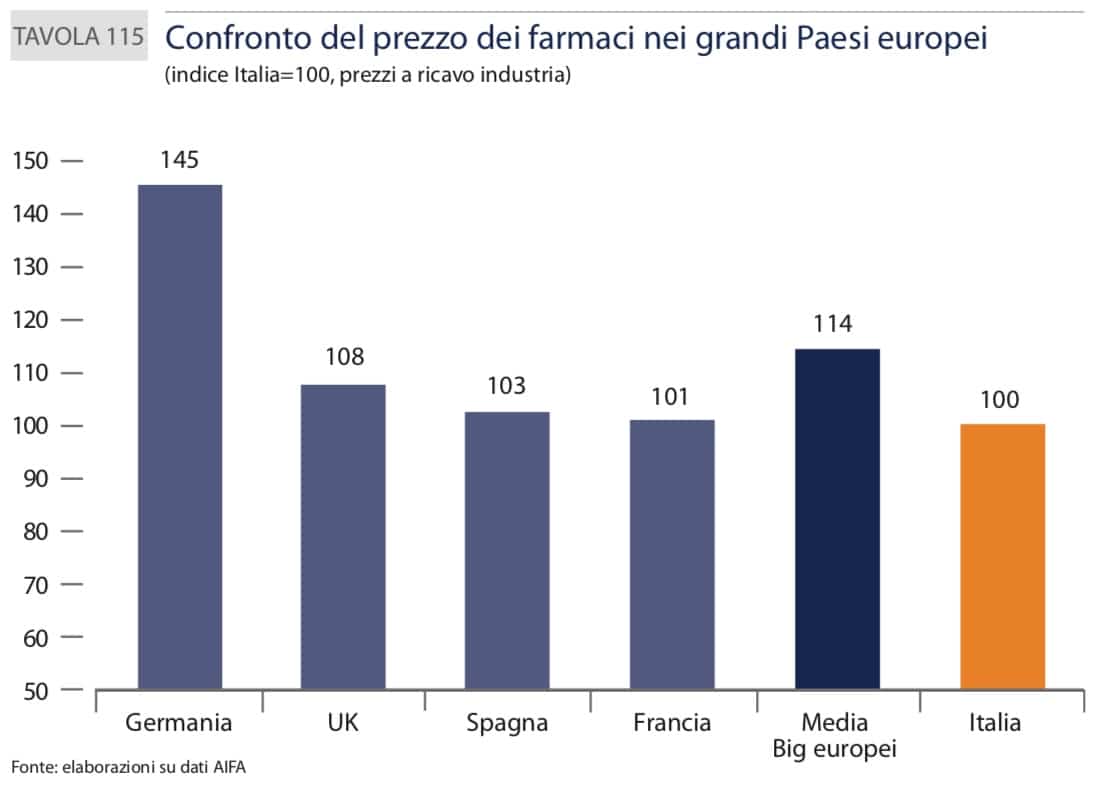
In comparison with the other EU countries, since 2001 Italy has shown a worse performance (-34.2% compared to an average of +31.8%). These data confirm the historical trend of the relationship between drug prices and inflation, generally declining in all European countries, but more rapidly in Italy.
The average industrial revenue in Italy for pharmacy products in 2019 is almost stable, although declining in the last ten years and among the lowest among the main EU countries (5.7 euros compared to an average of 10.4).
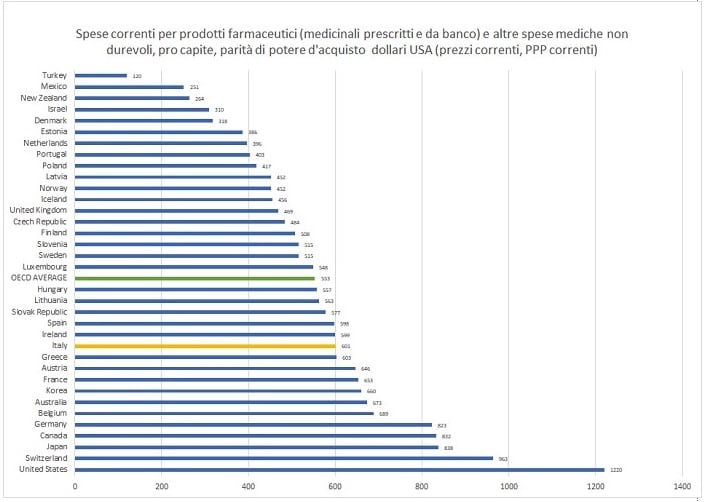
In the end the OECD makes a focus on spending on pharmaceuticals. La spesa corrente in percentuale (medicinali prescritti e da banco) assieme a quelle che l’Ocse definisce “altre spese mediche non durevoli” (che secondo le definizioni Istat sono i prodotti per la cura della persona, cioè saponi, cosmetici, ecc.), è del 17,5% in Italia e del 16,1% nella media Ocse, con tutti i maggiori partner Ue che registrano un’incidenza minore (Germania 14,1%; Francia 13,2%; Regno Unito 11,9%) e con l’Ungheria al top (27,9%) e la Danimarca fanalino di coda (6,3%).
The ranking changes slightly this time considering the per capita expenditure at purchasing power parity:Italy is at 601 dollars, the OECD average at 553. But of the major EU partners, it is still below the United Kingdom with 469 dollars, while France (653) and Germany (823) fly above Italy. The highest value is that of the United States which surpasses Switzerland with 1,220 dollars against 963, while this time Turkey is in line with 120 dollars per capita.
But assimilating medicines and bars of soap doesn't seem very correct to us.
In sostanza, come accade in molte cose, i dati cambiano a seconda di quello che vuole dimostrare l’osservatore. L’unico dato certo è che aveva ragione Einstein: tutto è relativo.
Related news: Gimbe Report. The 2010-2019 definancing of the NHS